Sketch the graph of a differentiable function whose derivatives satisfy given criteria.
Subsection3.7.1Activities
Remark3.7.1.
In Section 3.5 and Section 3.6 we learned how the first and second derivatives give us information about the graph of a function. Specifically, we can determine the intervals where a function is increasing, decreasing, concave up, or concave down as well as any local extrema or inflection points. Now we will put that information together to sketch the graph of a function.
Activity3.7.2.
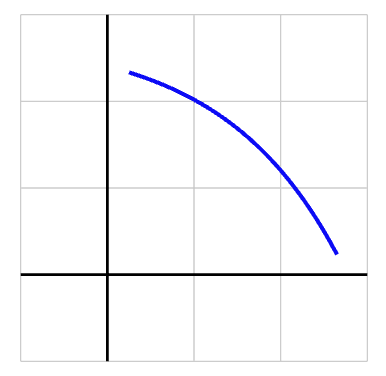
Which of the following features best describe the curve graphed below?
Figure74.
Increasing and concave up
Increasing and concave down
Decreasing and concave up
Decreasing and concave down
Activity3.7.3.
(a)
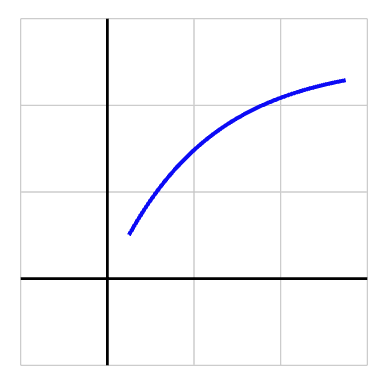
Which of the following features best describe the curve graphed below?
Figure75.
\(f'>0\) and \(f''>0\)
\(f'>0\) and \(f''<0 \)
\(f'<0\) and \(f''>0\)
\(f'<0\) and \(f''<0 \)
(b)
For each of the other three answer choices, sketch a curve that matches that description.
Activity3.7.4.
For each prompt that follows, sketch a possible graph of a function on the interval \(-3 \lt x \lt 3\) that satisfies the stated properties.
(a)
A function \(f(x)\) that is increasing on \(-3 \lt x \lt 3\text{,}\) concave up on \(-3 \lt x \lt 0\text{,}\) and concave down on \(0 \lt x \lt 3\text{.}\)
(b)
A function \(g(x)\) that is increasing on \(-3 \lt x \lt 3\text{,}\) concave down on \(-3 \lt x \lt 0\text{,}\) and concave up on \(0 \lt x \lt 3\text{.}\)
(c)
A function \(h(x)\) thatis decreasing on \(-3 \lt x \lt 3\text{,}\) concave up on \(-3 \lt x \lt -1\text{,}\) neither concave up nor concave down on \(-1 \lt x \lt 1\text{,}\) and concave down on \(1 \lt x \lt 3\text{.}\)
(d)
A function \(p(x)\) that is decreasing and concave down on \(-3 \lt x \lt 0\) and is increasing and concave down on \(0 \lt x \lt 3\text{.}\)
Observation3.7.5.
To draw an accurate sketch, we must keep in mind additional characteristics of a function, such as the domain and the horizontal and vertical asymptotes (when they exist). The next problem Activity 3.7.6 includes those aspects in addition to increasing, decreasing, and concavity features.
Activity3.7.6.
The following chart describes the values of \(f(x)\) and its first and second derivatives at or between a few given values of \(x\text{,}\) where \(\nexists\) denotes that \(f(x)\) does not exist at that value of \(x\text{.}\)
Assume that \(f(x)\) has vertical asymptotes at each \(x\)-value where \(f(x)\) does not exist, that \(\displaystyle \lim_{x\to-\infty}f(x)= 1\text{,}\) and that \(\displaystyle \lim_{x\to\infty}f(x)= -1\text{.}\)
(a)
List all the asymptotes of \(f(x)\) and mark them on the graph.
(b)
Does \(f(x)\) have any local maxima or local minima? If so, at what point(s)?
(c)
Does \(f(x)\) have any inflection points? If so, at what point(s)?
(d)
Use the information provided to sketch a reasonable graph of \(f(x)\text{.}\) Watch changes in behavior due to changes in the sign of each derivative.
Remark3.7.7.A guide to curve sketching.
Identify the domain of the function.
Identify any vertical or horizontal asymptotes, if they exist.
Find \(f'(x)\text{.}\) Then use it to determine the intervals where the function is increasing and the intervals where the function is decreasing. State any local extrema.
Find \(f''(x)\text{.}\) Then use it to determine the intervals where the function is concave up and the intervals where the function is concave down. State any inflection points.
Put everything together and draw sketch.
Activity3.7.8.
Sketch the graph of each of the following functions using the guide to curve sketching found in Remark 3.7.7